RJ
Repo for ryme1295 webpage
RJ, 2025
My full name is Ryan James Methven, but I just go by RJ. I am working towards graduate school, and this certificate program is my first step toward that goal. I have worked in the field on Niwot Ridge as a field technician, conducting snow surveys as well as animal surveys, installing and maintaining stream gauges, contributing to limnology research, and collecting biomass and air samples. In Isafjordur, Iceland, I was a research assistant for the meteorological office. I was responsible for organizing snowpit profiles over the past two years to be able to cross-examine other data sets. While I’m in this course, I have been working seasonally in parks and recreation, but im currently at the Boulder Home Depot.
Images of me
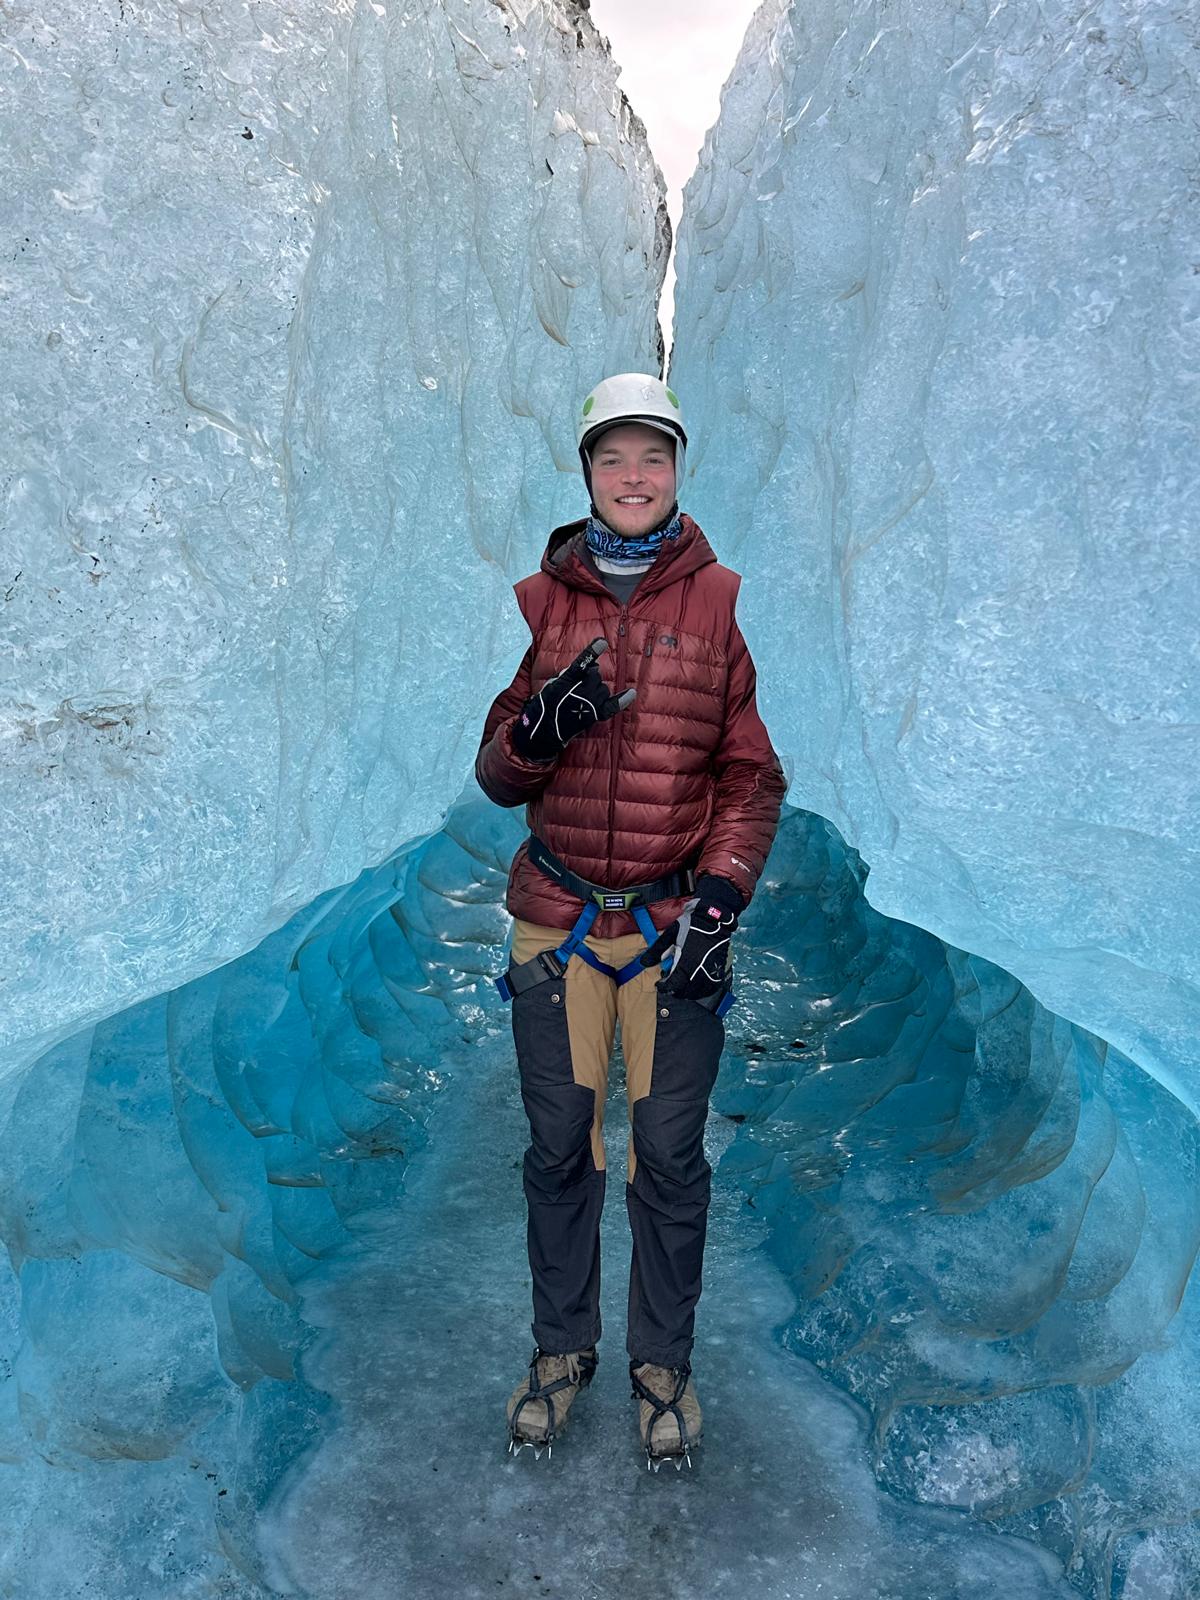
This picture was taken during my semester abroad in Iceland. We primarily focused on climate change in the Arctic, and I had the opportunity to work at the Icelandic Meteorological Office during my final project. During my time there, I was exposed to data analysis for snowpack profiles. I wasn’t able to work with Python at the time, and I felt limited. This motivated me to pursue this course and become proficient at analyzing data with a more complex and efficient programming language.

This is the Boulder watershed. I had the opportunity to work at the CU Mountain Research Center, where we conducted research on Niwot Ridge and in the Boulder Watershed.
Contact Information
- rjmethven3@gmail.com
- https://www.linkedin.com/in/rj-methven-82376a2a1/
- https://ryme1295.github.io/
Educational Background
High school: Proctor Academy Undergrad: University of Colorado Boulder Certificate program: Earth Data Analytics
Experience
Field Technician at CU Mountain Research Station. Research assistant at the Meteorological Office in Isafjordur, Iceland.
Exciting things about me
I love to ski, hike, and camp. I want to attend graduate school in Montana for Snow Hydrology. I am WFR certified, but looking to get my WEMT certificate.
Map of Montana State Missoula
I chose to map Montana State University at Missoula because I would like to attend grad school there after I have more experience with coding.
Portfolio Post work
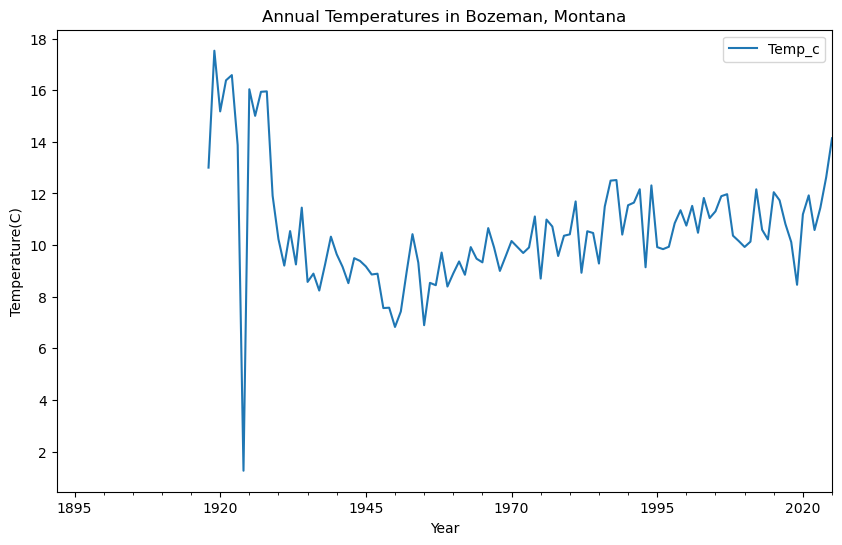 This is a picture of Bozeman Temperatures, dating back to the late 1800s. There is some noisy data at the beginning, possibly due to stations being moved. Beginning in the 1950s, a gradual warming trend was observed, showing more reliable data.
Veery Migration
Here’s a map of the Veery migration. Here’s a link to my repository https://github.com/earthlab-education/02-migration-ryme1295
Bluejay Migration
Here’s a map of the Blue Jay migration. Here’s a link to my repository https://github.com/earthlab-education/02-migration-ryme1295
Elkhorn Fire
Here’sa map of the elkhorn fire. Here’s a link to my repository [https://github.com/earthlab-education/04-vegetation-ryme1295/tree/main/notebooks]
Idaho fires
Chicago Obesity
[https://github.com/earthlab-education/spring-01-urban-greenspace-big-data-ryme1295] (file:///Users/ryanmethven/Documents/earth-analytics/UGS%20Portfolio%20Assignment/obesity_choropleth.html) Here is a map showing rates of obesity in the southern part of Chicago, with a separate concentration closer to the city’s center. These patterns may be partly influenced by the distribution of green space and vegetation, which tends to be more limited in lower-income and less desirable areas. Reduced access to green areas can discourage physical activity and is often associated with poorer food environments and higher stress levels. Together, these factors can contribute to higher obesity rates in neighborhoods with fewer environmental and recreational resources.
Final project
Here is a map showing the boundary of the Boulder watershed.